
<!DOCTYPE html PUBLIC "-//W3C//DTD XHTML 1.0 Strict//EN" "http://www.w3.org/TR/xhtml1/DTD/xhtml1-strict.dtd">
<html xmlns="http://www.w3.org/1999/xhtml">
<head>
<meta http-equiv="content-type" content="text/html; charset=utf-8"/>
<title>2011년 예약일</title>
<script type="text/javascript" src="https://www.google.com/jsapi"></script>
<script type="text/javascript">
google.load('visualization', '1', {packages: ['corechart']});
</script>
<script type="text/javascript">
function drawVisualization() {
// Some raw data (not necessarily accurate)
var data = google.visualization.arrayToDataTable([
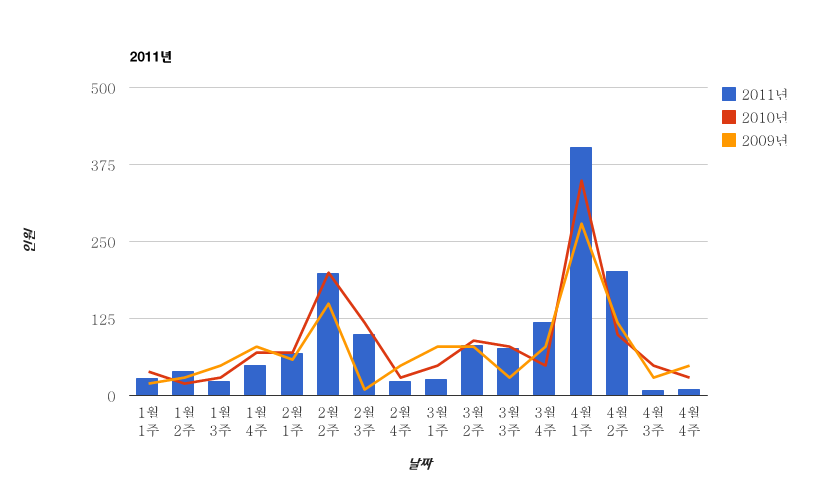
['날짜', '2011년', '2010년', '2009년'],
['1월 1주', 30, 40, 20],
['1월 2주', 40, 20, 30],
['1월 3주', 25, 30, 50],
['1월 4주', 50, 70, 80],
['2월 1주', 70, 70, 60],
['2월 2주', 200, 200, 150],
['2월 3주', 100, 120, 10],
['2월 4주', 25, 30, 50],
['3월 1주', 28, 50, 80],
['3월 2주', 83, 90, 80],
['3월 3주', 78, 80, 30],
['3월 4주', 120, 50, 80],
['4월 1주', 405, 350, 280],
['4월 2주', 203, 100, 120],
['4월 3주', 10, 50, 30],
['4월 4주', 11, 30, 50]
]);
var options = {
title : '2011년 ',
vAxis: {title: "인원"},
hAxis: {title: "날짜"},
seriesType: "bars",
series: {1: {type: "line"},2: {type: "line"}}
};
var chart = new google.visualization.ComboChart(document.getElementById('chart_div'));
chart.draw(data, options);
}
google.setOnLoadCallback(drawVisualization);
</script>
</head>
<body>
<div id="chart_div" style="width: 900px; height: 500px;"></div>
</body>
</html>- [2015/02/05] 구글맵 마커 + 말풍선 - v3 (3284) *2
- [2014/08/04] 구글맵 v3 맵상에 보여지는 마커만 생성하기 (7612) *5
- [2014/07/17] 구글맵 v3 - 마커 + 말풍선 + GPS 연동+ 원그리기 + 동적 마커 생성( Ajax + Json ) (16964) *24
- [2014/04/21] Google 웹사이트 번역기 (5320) *2
- [2013/10/18] Google Places API를 이용한 주변 지역 정보 검색 (21363) *26
 막대 그래프
 선 그래프
선 그래프